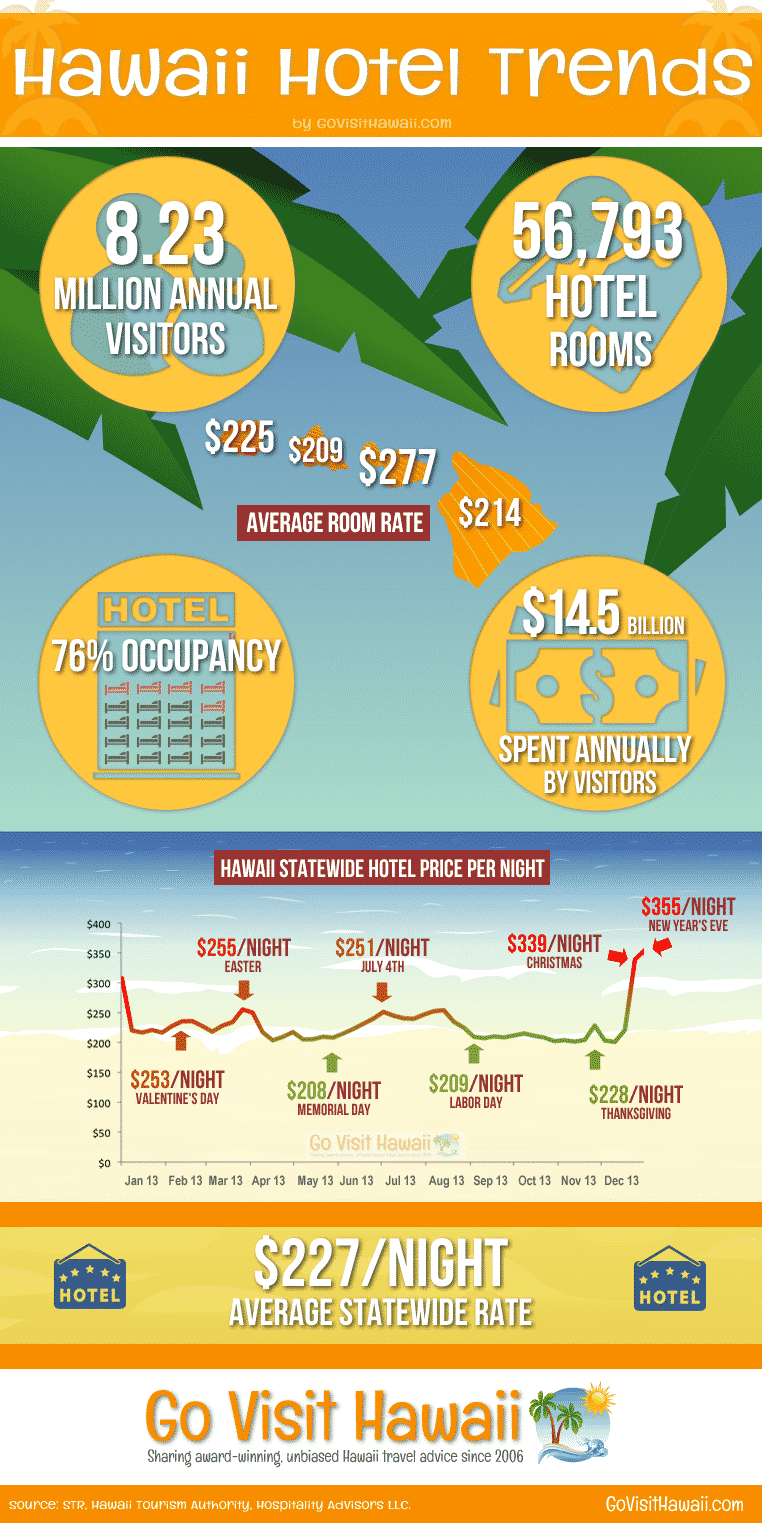
2019 Update: we’ve analyzed fresher data that has become available. You can review that in detail on our page: Hawaii Visitor Data Report: Visitor Numbers, Hotel Rates, Visitor Spending. The seasonal trends remain the same, however average hotel rate increased to $277.
—
Andy and I have put together this infographic with lots of useful and interesting information about Hawaii hotel and visitor statistics. Here, you’ll find the freshest annual data from 2013, that shows the annual visitors to Hawaii, the average hotel occupancy for the year, the average statewide hotel rate for Hawaii, the average hotel rates by island, the weekly hotel rate chart depicting the seasonality effect on demand, and more!
Want to share this infographic? Please use the code below:
Our data was sourced from the Hawaii Tourism Authority, STR and Hospitality Advisors. All data is from 2013.
Were you surprised by any of these numbers?


2 comments
Nice graphic! Interesting to see Maui with the highest average hotel price, but not too surprising.
Great infographic. I think I will use it on my site for those who want to visit before moving. As usual, awesome content from you guys.
Mahalo for being here.
Ken